t检验
// 导入数据 "data/data2aitt" , sheet("data2aitt" ) firstrow clear // firstrow: treat first row of Excel data as variable names
  ___  ____  ____  ____  ____ ©
 /__    /   ____/   /   ____/      17.0
___/   /   /___/   /   /___/       BE—Basic Edition

 Statistics and Data Science       Copyright 1985-2021 StataCorp LLC
                                   StataCorp
                                   4905 Lakeway Drive
                                   College Station, Texas 77845 USA
                                   800-STATA-PC        https://www.stata.com
                                   979-696-4600        stata@stata.com

Stata license: Single-user  perpetual
Serial number: 301706350312
  Licensed to: Clinical Research Center
               Maoming People's Hospital

Notes:
      1. Unicode is supported; see help unicode_advice.
(54 vars, 240 obs)
Contains data
 Observations:           240
    Variables:            54
-------------------------------------------------------------------------------
Variable      Storage   Display    Value
    name         type    format    label      Variable label
-------------------------------------------------------------------------------
Group           byte    %10.0g                Group
ID              int     %10.0g                ID
Comorbidity     byte    %10.0g                Comorbidity
Age             byte    %10.0g                Age
Height          double  %10.0g                Height
Weight          double  %10.0g                Weight
BMI             double  %10.0g                BMI
Gender          byte    %10.0g                Gender
Education       byte    %10.0g                Education
Smoking         byte    %10.0g                Smoking
Ysmoking        byte    %10.0g                Ysmoking
Drinking        byte    %10.0g                Drinking
Ydrinking       byte    %10.0g                Ydrinking
Allergy         byte    %10.0g                Allergy
Tem             double  %10.0g                Tem
HR              int     %10.0g                HR
RR              byte    %10.0g                RR
SBP             int     %10.0g                SBP
DBP             int     %10.0g                DBP
BCSS0           byte    %10.0g                BCSS0
BCSS1           byte    %10.0g                BCSS1
BCSS2           byte    %10.0g                BCSS2
BCSS3           double  %10.0g                BCSS3
BCSS4           byte    %10.0g                BCSS4
BCSS5           double  %10.0g                BCSS5
VASB0           double  %10.0g                VASB0
VASB1           double  %10.0g                VASB1
VASB2           double  %10.0g                VASB2
VASB3           double  %10.0g                VASB3
VASB4           double  %10.0g                VASB4
VASB5           double  %10.0g                VASB5
VASC0           double  %10.0g                VASC0
VASC1           double  %10.0g                VASC1
VASC2           double  %10.0g                VASC2
VASC3           double  %10.0g                VASC3
VASC4           double  %10.0g                VASC4
VASC5           double  %10.0g                VASC5
Hospitaldurat~n byte    %10.0g                Hospital duration
Death           byte    %10.0g                Death
CB1             byte    %10.0g                CB1
CB2             byte    %10.0g                CB2
CB3             double  %10.0g                CB3
CB4             byte    %10.0g                CB4
CB5             double  %10.0g                CB5
CVASB1          double  %10.0g                CVASB1
CVASB2          double  %10.0g                CVASB2
CVASB3          double  %10.0g                CVASB3
CVASB4          double  %10.0g                CVASB4
CVASB5          double  %10.0g                CVASB5
CVASC1          double  %10.0g                CVASC1
CVASC2          double  %10.0g                CVASC2
CVASC3          double  %10.0g                CVASC3
CVASC4          double  %10.0g                CVASC4
CVASC5          double  %10.0g                CVASC5
-------------------------------------------------------------------------------
Sorted by:
     Note: Dataset has changed since last saved.
// 检验各个变量之间的差异,by group name ttest BCSS0, by (Group)ttest BCSS1, by (Group)ttest BCSS2, by (Group)ttest BCSS3, by (Group)ttest BCSS4, by (Group)ttest BCSS5, by (Group)
Two-sample t test with equal variances
------------------------------------------------------------------------------
   Group |     Obs        Mean    Std. err.   Std. dev.   [95% conf. interval]
---------+--------------------------------------------------------------------
       0 |     120       5.625    .1806704    1.979145    5.267254    5.982746
       1 |     120    5.816667    .1782986    1.953163    5.463618    6.169716
---------+--------------------------------------------------------------------
Combined |     240    5.720833    .1268033    1.964428    5.471039    5.970628
---------+--------------------------------------------------------------------
    diff |           -.1916667     .253835               -.6917169    .3083835
------------------------------------------------------------------------------
    diff = mean(0) - mean(1)                                      t =  -0.7551
H0: diff = 0                                     Degrees of freedom =      238

    Ha: diff < 0                 Ha: diff != 0                 Ha: diff > 0
 Pr(T < t) = 0.2255         Pr(|T| > |t|) = 0.4509          Pr(T > t) = 0.7745

Two-sample t test with equal variances
------------------------------------------------------------------------------
   Group |     Obs        Mean    Std. err.   Std. dev.   [95% conf. interval]
---------+--------------------------------------------------------------------
       0 |     120       5.075    .1795429    1.966794    4.719487    5.430513
       1 |     120    4.966667    .1714714    1.878375    4.627136    5.306197
---------+--------------------------------------------------------------------
Combined |     240    5.020833    .1239247    1.919832    4.776709    5.264957
---------+--------------------------------------------------------------------
    diff |            .1083333    .2482702               -.3807543     .597421
------------------------------------------------------------------------------
    diff = mean(0) - mean(1)                                      t =   0.4364
H0: diff = 0                                     Degrees of freedom =      238

    Ha: diff < 0                 Ha: diff != 0                 Ha: diff > 0
 Pr(T < t) = 0.6685         Pr(|T| > |t|) = 0.6630          Pr(T > t) = 0.3315

Two-sample t test with equal variances
------------------------------------------------------------------------------
   Group |     Obs        Mean    Std. err.   Std. dev.   [95% conf. interval]
---------+--------------------------------------------------------------------
       0 |     120    4.458333    .1738894    1.904863    4.114015    4.802652
       1 |     120         3.9    .1624394    1.779434    3.578354    4.221646
---------+--------------------------------------------------------------------
Combined |     240    4.179167    .1200953    1.860508    3.942586    4.415747
---------+--------------------------------------------------------------------
    diff |            .5583333    .2379581                .0895602    1.027106
------------------------------------------------------------------------------
    diff = mean(0) - mean(1)                                      t =   2.3464
H0: diff = 0                                     Degrees of freedom =      238

    Ha: diff < 0                 Ha: diff != 0                 Ha: diff > 0
 Pr(T < t) = 0.9901         Pr(|T| > |t|) = 0.0198          Pr(T > t) = 0.0099

Two-sample t test with equal variances
------------------------------------------------------------------------------
   Group |     Obs        Mean    Std. err.   Std. dev.   [95% conf. interval]
---------+--------------------------------------------------------------------
       0 |     120    3.820833    .1588646    1.740274    3.506266    4.135401
       1 |     120    2.941667    .1431419    1.568041    2.658231    3.225102
---------+--------------------------------------------------------------------
Combined |     240     3.38125      .11042    1.710619    3.163729    3.598771
---------+--------------------------------------------------------------------
    diff |            .8791667      .21384                .4579057    1.300428
------------------------------------------------------------------------------
    diff = mean(0) - mean(1)                                      t =   4.1113
H0: diff = 0                                     Degrees of freedom =      238

    Ha: diff < 0                 Ha: diff != 0                 Ha: diff > 0
 Pr(T < t) = 1.0000         Pr(|T| > |t|) = 0.0001          Pr(T > t) = 0.0000

Two-sample t test with equal variances
------------------------------------------------------------------------------
   Group |     Obs        Mean    Std. err.   Std. dev.   [95% conf. interval]
---------+--------------------------------------------------------------------
       0 |     120       3.175    .1590688    1.742511    2.860028    3.489972
       1 |     120    2.241667    .1405251    1.539376    1.963413     2.51992
---------+--------------------------------------------------------------------
Combined |     240    2.708333     .110121    1.705987    2.491402    2.925265
---------+--------------------------------------------------------------------
    diff |            .9333333    .2122503                .5152042    1.351462
------------------------------------------------------------------------------
    diff = mean(0) - mean(1)                                      t =   4.3973
H0: diff = 0                                     Degrees of freedom =      238

    Ha: diff < 0                 Ha: diff != 0                 Ha: diff > 0
 Pr(T < t) = 1.0000         Pr(|T| > |t|) = 0.0000          Pr(T > t) = 0.0000

Two-sample t test with equal variances
------------------------------------------------------------------------------
   Group |     Obs        Mean    Std. err.   Std. dev.   [95% conf. interval]
---------+--------------------------------------------------------------------
       0 |     120    2.798333    .1599106    1.751733    2.481694    3.114972
       1 |     120    1.591667    .1180466    1.293135    1.357923    1.825411
---------+--------------------------------------------------------------------
Combined |     240       2.195    .1065755     1.65106    1.985053    2.404947
---------+--------------------------------------------------------------------
    diff |            1.206667    .1987622                .8151089    1.598224
------------------------------------------------------------------------------
    diff = mean(0) - mean(1)                                      t =   6.0709
H0: diff = 0                                     Degrees of freedom =      238

    Ha: diff < 0                 Ha: diff != 0                 Ha: diff > 0
 Pr(T < t) = 1.0000         Pr(|T| > |t|) = 0.0000          Pr(T > t) = 0.0000
// generate new variable gen deltaBCSS1 = BCSS1-BCSS0gen deltaBCSS2 = BCSS2-BCSS0 gen deltaBCSS3 = BCSS3-BCSS0gen deltaBCSS4 = BCSS4-BCSS0gen deltaBCSS5 = BCSS5-BCSS0
ttest deltaBCSS1, by (Group)ttest deltaBCSS2, by (Group)ttest deltaBCSS3, by (Group)ttest deltaBCSS4, by (Group)ttest deltaBCSS5, by (Group)
Two-sample t test with equal variances
------------------------------------------------------------------------------
   Group |     Obs        Mean    Std. err.   Std. dev.   [95% conf. interval]
---------+--------------------------------------------------------------------
       0 |     120        -.55    .0718405    .7869738   -.6922515   -.4077485
       1 |     120        -.85    .1015634    1.112571   -1.051106   -.6488943
---------+--------------------------------------------------------------------
Combined |     240         -.7    .0628252    .9732833   -.8237618   -.5762382
---------+--------------------------------------------------------------------
    diff |                  .3    .1244033                .0549277    .5450723
------------------------------------------------------------------------------
    diff = mean(0) - mean(1)                                      t =   2.4115
H0: diff = 0                                     Degrees of freedom =      238

    Ha: diff < 0                 Ha: diff != 0                 Ha: diff > 0
 Pr(T < t) = 0.9917         Pr(|T| > |t|) = 0.0166          Pr(T > t) = 0.0083

Two-sample t test with equal variances
------------------------------------------------------------------------------
   Group |     Obs        Mean    Std. err.   Std. dev.   [95% conf. interval]
---------+--------------------------------------------------------------------
       0 |     120   -1.166667    .1040721    1.140053    -1.37274   -.9605935
       1 |     120   -1.916667    .1383088    1.515097   -2.190532   -1.642801
---------+--------------------------------------------------------------------
Combined |     240   -1.541667    .0897058    1.389716   -1.718382   -1.364952
---------+--------------------------------------------------------------------
    diff |                 .75    .1730905                .4090149    1.090985
------------------------------------------------------------------------------
    diff = mean(0) - mean(1)                                      t =   4.3330
H0: diff = 0                                     Degrees of freedom =      238

    Ha: diff < 0                 Ha: diff != 0                 Ha: diff > 0
 Pr(T < t) = 1.0000         Pr(|T| > |t|) = 0.0000          Pr(T > t) = 0.0000

Two-sample t test with equal variances
------------------------------------------------------------------------------
   Group |     Obs        Mean    Std. err.   Std. dev.   [95% conf. interval]
---------+--------------------------------------------------------------------
       0 |     120   -1.804167    .1197125    1.311385   -2.041209   -1.567124
       1 |     120      -2.875    .1541047    1.688132   -3.180143   -2.569857
---------+--------------------------------------------------------------------
Combined |     240   -2.339583    .1033415    1.600959    -2.54316   -2.136007
---------+--------------------------------------------------------------------
    diff |            1.070833    .1951393                .6864126    1.455254
------------------------------------------------------------------------------
    diff = mean(0) - mean(1)                                      t =   5.4875
H0: diff = 0                                     Degrees of freedom =      238

    Ha: diff < 0                 Ha: diff != 0                 Ha: diff > 0
 Pr(T < t) = 1.0000         Pr(|T| > |t|) = 0.0000          Pr(T > t) = 0.0000

Two-sample t test with equal variances
------------------------------------------------------------------------------
   Group |     Obs        Mean    Std. err.   Std. dev.   [95% conf. interval]
---------+--------------------------------------------------------------------
       0 |     120       -2.45    .1182565    1.295435    -2.68416    -2.21584
       1 |     120      -3.575     .155056    1.698554   -3.882026   -3.267974
---------+--------------------------------------------------------------------
Combined |     240     -3.0125     .103879    1.609286   -3.217135   -2.807865
---------+--------------------------------------------------------------------
    diff |               1.125     .195005                .7408437    1.509156
------------------------------------------------------------------------------
    diff = mean(0) - mean(1)                                      t =   5.7691
H0: diff = 0                                     Degrees of freedom =      238

    Ha: diff < 0                 Ha: diff != 0                 Ha: diff > 0
 Pr(T < t) = 1.0000         Pr(|T| > |t|) = 0.0000          Pr(T > t) = 0.0000

Two-sample t test with equal variances
------------------------------------------------------------------------------
   Group |     Obs        Mean    Std. err.   Std. dev.   [95% conf. interval]
---------+--------------------------------------------------------------------
       0 |     120   -2.826667    .1390833    1.523581   -3.102065   -2.551268
       1 |     120      -4.225     .161602    1.770261   -4.544988   -3.905012
---------+--------------------------------------------------------------------
Combined |     240   -3.525833    .1155968    1.790818   -3.753552   -3.298115
---------+--------------------------------------------------------------------
    diff |            1.398333     .213212                .9783096    1.818357
------------------------------------------------------------------------------
    diff = mean(0) - mean(1)                                      t =   6.5584
H0: diff = 0                                     Degrees of freedom =      238

    Ha: diff < 0                 Ha: diff != 0                 Ha: diff > 0
 Pr(T < t) = 1.0000         Pr(|T| > |t|) = 0.0000          Pr(T > t) = 0.0000
回归
      Source |       SS           df       MS      Number of obs   =        74
-------------+----------------------------------   F(1, 72)        =     20.26
       Model |   139449474         1   139449474   Prob > F        =    0.0000
    Residual |   495615923        72  6883554.48   R-squared       =    0.2196
-------------+----------------------------------   Adj R-squared   =    0.2087
       Total |   635065396        73  8699525.97   Root MSE        =    2623.7

------------------------------------------------------------------------------
       price | Coefficient  Std. err.      t    P>|t|     [95% conf. interval]
-------------+----------------------------------------------------------------
         mpg |  -238.8943   53.07669    -4.50   0.000    -344.7008   -133.0879
       _cons |   11253.06   1170.813     9.61   0.000     8919.088    13587.03
------------------------------------------------------------------------------
To get standardized coefficients we add the beta option to our command.
      Source |       SS           df       MS      Number of obs   =        74
-------------+----------------------------------   F(1, 72)        =     20.26
       Model |   139449474         1   139449474   Prob > F        =    0.0000
    Residual |   495615923        72  6883554.48   R-squared       =    0.2196
-------------+----------------------------------   Adj R-squared   =    0.2087
       Total |   635065396        73  8699525.97   Root MSE        =    2623.7

------------------------------------------------------------------------------
       price | Coefficient  Std. err.      t    P>|t|                     Beta
-------------+----------------------------------------------------------------
         mpg |  -238.8943   53.07669    -4.50   0.000                -.4685967
       _cons |   11253.06   1170.813     9.61   0.000                        .
------------------------------------------------------------------------------
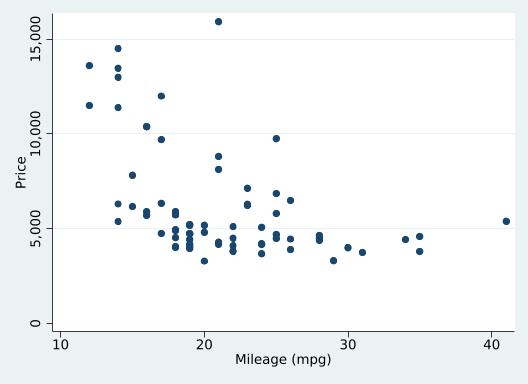
Visualizing Regression Lines
graph twoway scatter price mpg
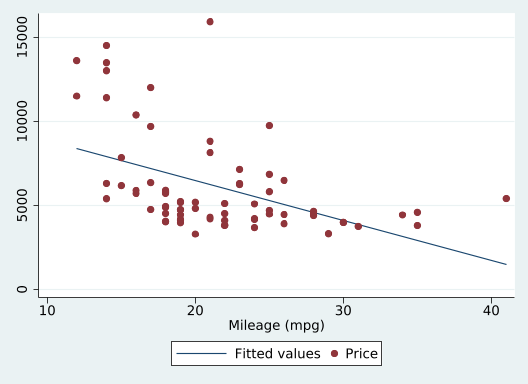
Add the regression line to the plot. The lfit graph command allows us to do this (lfit stands for linear fit). However, we don’t want the regression line in isolation. We want it on top of the scatterplot. Stata lets you combine twoway graphs in one of two ways: (1) using parentheses or (2) using pipes.
graph twoway (lfit price mpg) (scatter price mpg)
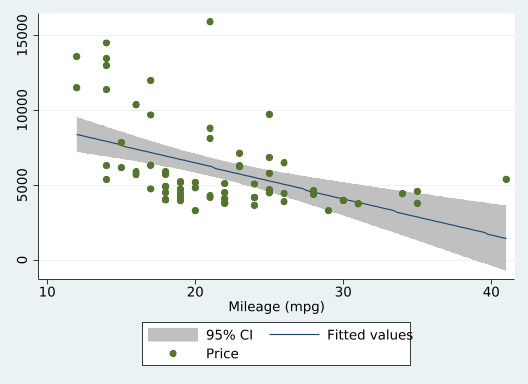
graph twoway lfitci price mpg || scatter price mpg
关联
weight length
(obs=74)

             |    price      mpg   weight   length
-------------+------------------------------------
       price |   1.0000
         mpg |  -0.4686   1.0000
      weight |   0.5386  -0.8072   1.0000
      length |   0.4318  -0.7958   0.9460   1.0000
corr price mpg weigh length , covariance
(obs=74)

             |    price      mpg   weight   length
-------------+------------------------------------
       price |  8.7e+06
         mpg | -7996.28   33.472
      weight |  1.2e+06 -3629.43   604030
      length |  28360.3 -102.514  16370.9   495.79
pwcorr price mpg weight length , sig
             |    price      mpg   weight   length
-------------+------------------------------------
       price |   1.0000
             |
             |
         mpg |  -0.4686   1.0000
             |   0.0000
             |
      weight |   0.5386  -0.8072   1.0000
             |   0.0000   0.0000
             |
      length |   0.4318  -0.7958   0.9460   1.0000
             |   0.0001   0.0000   0.0000
             |