# 扇形图例标识
import matplotlib.pyplot as plt
# 这两行代码解决 plt 中文显示的问题
plt.rcParams['font.sans-serif'] = ['SimHei']
plt.rcParams['axes.unicode_minus'] = False
# 扇形图例标识
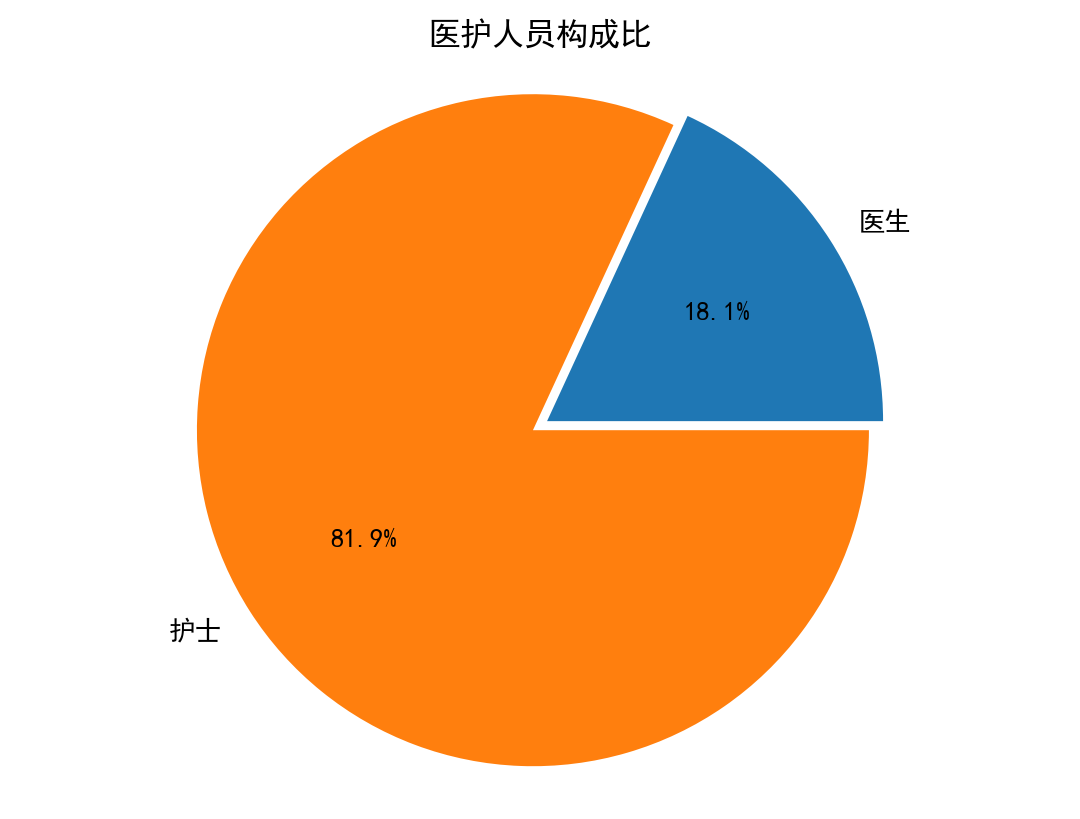
labels = ['医生', '护士']
# 扇形大小
sizes = [33, 149]
# 第二块扇形偏移
explode = [0, 0.05]
# 创建图形
fig, ax = plt.subplots()
# 开始画饼图
ax.pie(sizes, labels=labels, explode=explode, autopct='%1.1f%%')
# 确保画的饼是圆的
ax.axis('equal');
# 标题
ax.set_title('医护人员构成比');
# 设置图例
# ax.legend(labels=labels);
# fig.savefig('ratio1.jpg',dpi=300)