import json
import re
mindmap_str = '''
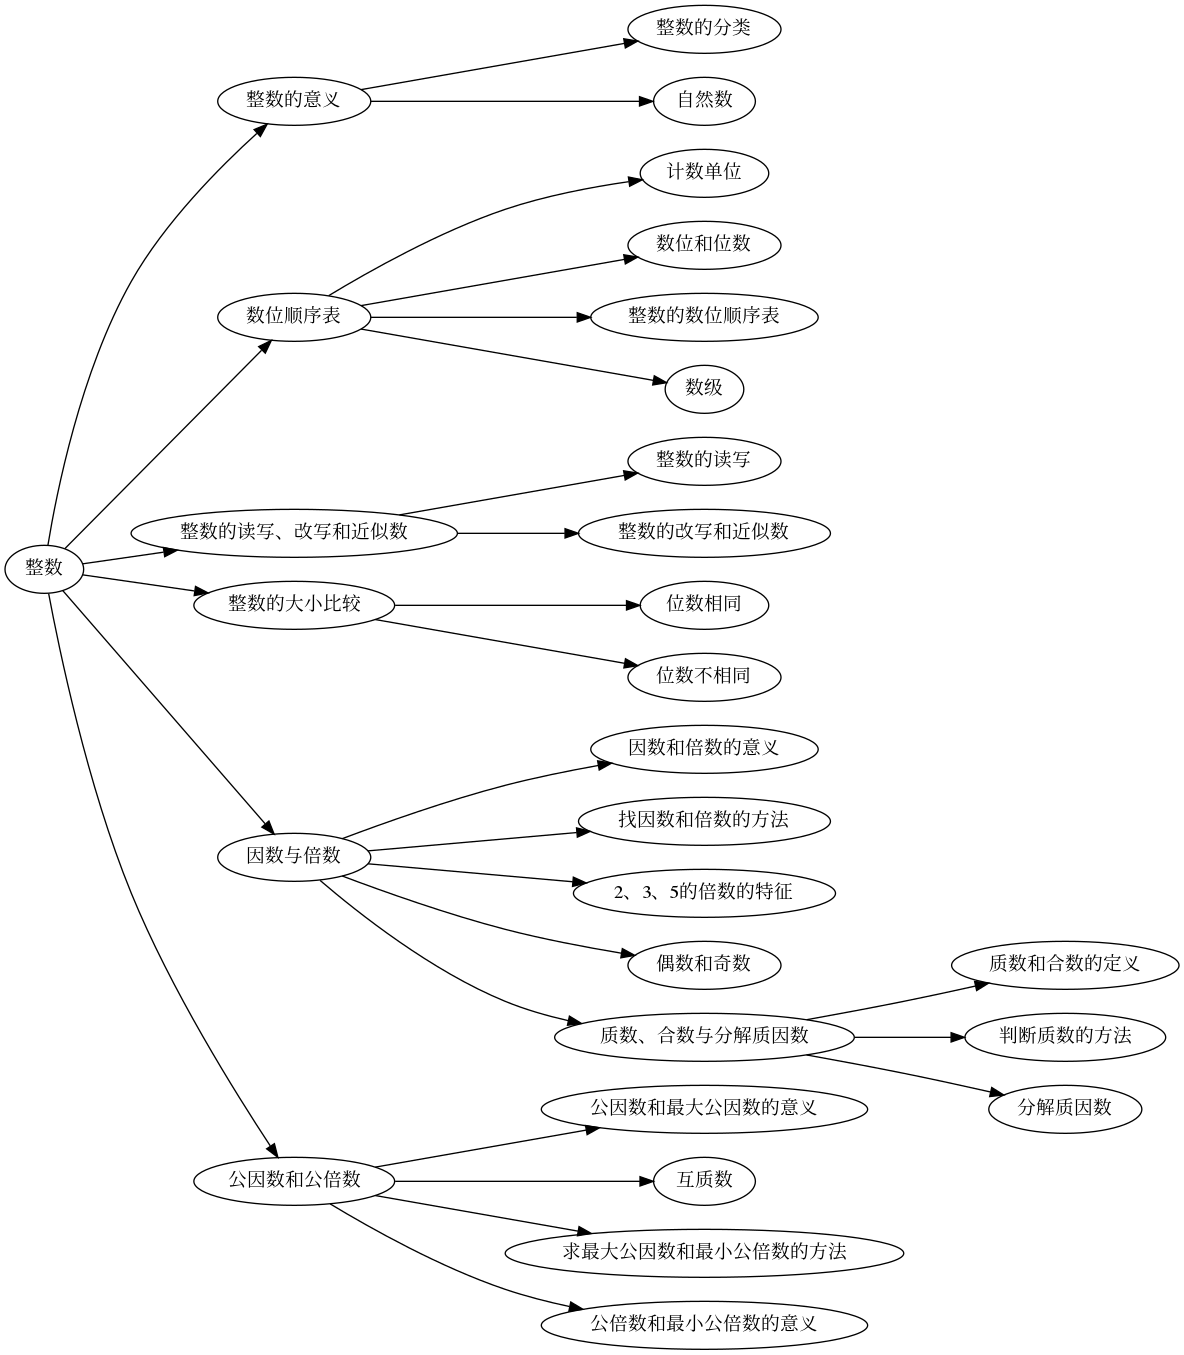
# 整数
## 整数的意义
### 整数的分类
### 自然数
## 数位顺序表
### 计数单位
### 数位和位数
### 整数的数位顺序表
### 数级
## 整数的读写、改写和近似数
### 整数的读写
### 整数的改写和近似数
## 整数的大小比较
### 位数相同
### 位数不相同
## 因数与倍数
### 因数和倍数的意义
### 找因数和倍数的方法
### 2、3、5的倍数的特征
### 偶数和奇数
### 质数、合数与分解质因数
#### 质数和合数的定义
#### 判断质数的方法
#### 分解质因数
## 公因数和公倍数
### 公因数和最大公因数的意义
### 互质数
### 求最大公因数和最小公倍数的方法
### 公倍数和最小公倍数的意义
'''
def generate_mindmap_data(markdown_content, match_pattern):
links = []
stack = [(-1, {'children': links})]
level_counters = [0]
for line in markdown_content.split('\n'):
match = re.match(match_pattern, line)
if match:
level = len(match.group(1))
name = match.group(2).strip()
link = {'name': name, 'children': []}
stack[level - 1][1]['children'].append(link)
stack[level:] = [(level, link)]
return links
match_pattern = r'^(#+)\s*(.*)'
mindmap_dict = generate_mindmap_data(mindmap_str, match_pattern)
# print(
# (json
# .dumps(mindmap_dict,
# indent=2,
# ensure_ascii=False)
# )
# )
from graphviz import Digraph
def add_nodes_edges(dot, data, parent=None):
for item in data:
name = item["name"]
if parent:
dot.edge(parent, name,
# constraint='true'
)
dot.node(name, name,
# shape='box', # 设置节点形状为矩形
)
if "children" in item:
add_nodes_edges(dot, item["children"], parent=name)
# 创建Digraph对象
dot = Digraph(format='png',
graph_attr={'rankdir': 'LR',
# # 'bgcolor': 'lightgray',
# 'fontname': 'Arial',
# 'fontsize': '14',
# 'label': '整数',
# 'labelloc': 't',
# 'margin': '0.5',
# 'nodesep': '1.5',
'ranksep': '0.5'
},
edge_attr={
# 'tailport': 'e',
# 'headport': 'w',
}
)
# 添加节点和边
add_nodes_edges(dot, mindmap_dict)
# 渲染并保存图像
mm = dot.render('tree', view=False)
display(Image(mm))